Tactile graphics are raised surface representations of non-textual information, such as graphs, maps, or diagrams, allowing those who are blind or who have low vision to better understand the content. By request, ATI staff will provide tactile graphics to students, faculty, and staff with a documented print disability.
In this tactile graphic of a map showing the South Atlantic Ocean and part of Africa, you can see the raised dots of braille, as well as raised lines showing different aspects of the map. There are also yellow dot stickers to indicate certain areas on the map.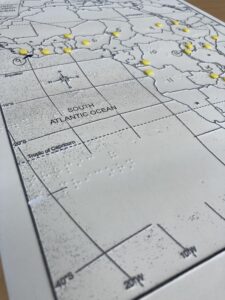
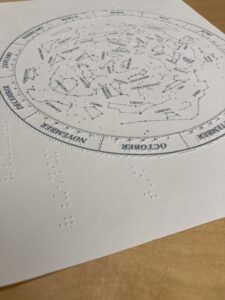
This is one page of a set of tactile graphics designed to teach the location and shape of constellations.
The ATI uses image creation software called Tactile View to create and print tactile graphics.
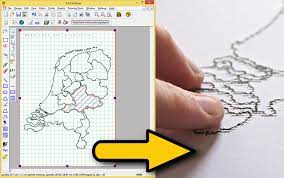
This tactile graphic image file shows the outline of shapes and various densities of dots.
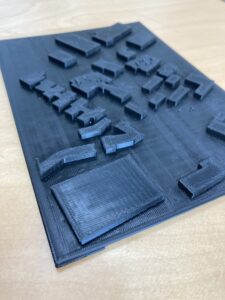
This is a prototype of a 3D printed map. The ATI is working on creating a version of the Fairfax Campus Map that can be 3D printed, and embossed as a tactile graphic.